by Zack Kroll
Graph
How would you change the equations to explore other graphs?
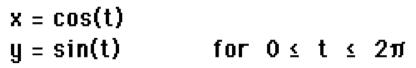
For the parametric functions:
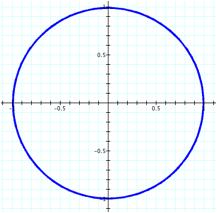
the graph will be a circle for
Our goal is to examine these parametric functions and determine how changing these equations will affect the graphs.
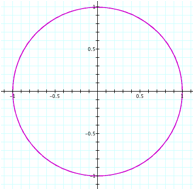
We will begin by manipulating the parameter t. When
![]() it appears that the graph does not change from the original
example given.
it appears that the graph does not change from the original
example given.
![]()
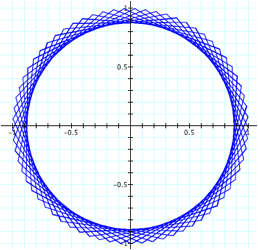
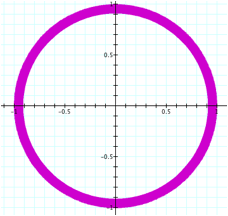
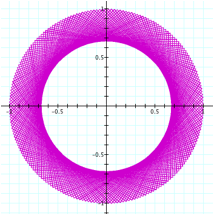
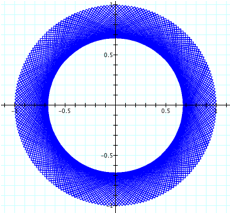
However once we increase the upper bound of t to be 500, the circle that was once thing becomes much thicker. It becomes so thick that it appears to be a full 1/10 of a unit. As the upper bound continues to increase we observe a less uniform graph (e.g. 0 < t < 1000 and 0 < t < 5000).
![]()
![]()
![]()
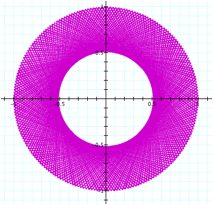
What if the lower bound of t is no longer 0? How will that affect the graph of the parametric function?
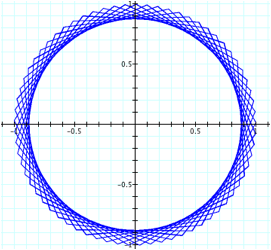
We examine three graphs in which the upper and lower bounds have the same absolute value, but are of opposite signs. The first graph
![]()
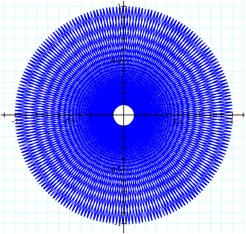
is similar to the graph where 0 < t < 100. This leads us to believe that the lower bound does not have any affect on the shape of the graph. Upon further investigation it is not the value of the lower or upper bounds, but rather the range of the parameter t. The greater the range, the larger the ring and more fanciful the graph.
![]()
![]()
![]()
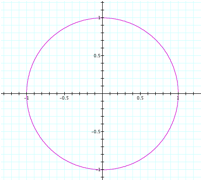
In order to determine whether the conclusion we developed using the previous examples holds up, we decide to examine the graph below. These graphs have different upper and lower bounds, but the same range of values for t. As we can see they are clearly the same graph. This leads us to believe that with parametric equations the driving factor in how the graph will take shape is the range of values for t.
![]()
![]()